
NE Winter 2010-2011 and the Mid-Atlantic Snow Hole
NE Winter 2010-2011 and the Mid-Atlantic Snow Hole
Apr 14, 2011; 1:07 PM ET
The last time I updated you on the status of snowfall compared to normal this winter was in a blog on February 7th. Now that March is done (and hence is most of the winter) I’d like to revisit these numbers and see who got snowed in and who got the proverbial shaft (or lucky, if you don’t like snow). Here’s a map showing winners and losers out of the 55 stations I looked at:
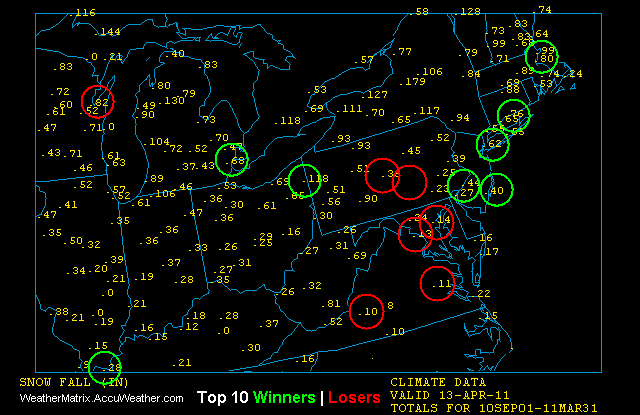
You can see a clear grouping of winners in the major cities of the Northeast, with losers in the mid-Atlantic. For the period September 2010 through March 2011, the top 10 winners are:
The winners were the “Over 200% of normal club” (those cities who got twice their average seasonal snowfall, or more) and here they are (drum roll please):
PADUCAH KY (271%)
ATLANTIC CITY AP, NJ (260%)
NEW YORK, NY (225%)
YOUNGSTOWN, OH (221%)
PHILADELPHIA, PA (218%)
The top losers (those with less than 85% of normal) were:
ROANOKE, VA (46%)
WASHINGTON D.C. (60%)
BALTIMORE, MD (70%)
HARRISBURG, PA (71%)
RICHMOND, VA (79%)
STATE COLLEGE, PA (84%)
But only Roanoke can claim less than half their seasonal total this season. If you map out those locations, it gives you an idea of where the “snow hole” was this season, and the deep departures continued in the mid-Atlantic all season long.
A complete list of my cities is shown below. You can get more statistics for other cities and records in our End of Winter Summary article (coming soon). As you can tell by the rankings, at the end of January, there was still some reshuffling to do but by the end of February, the writing was on the wall.

You Might Also Like Our Friends' Posts
Leave a Reply


 Choosing from the best US Canadian and international sources, we gather and select weather stories from around the world. World Weather Post not only brings you breaking news about people affected by weather, but also provides insight on how weather is affected by people. You will also find a sense of humour and a curiosity for understanding the weather, climate change and the environment. We encourage you to use our blog to express your opinion and share your stories and knowledge. World Weather Post, where everybody talks about the weather.